After Effects
After Effects – Motion Graphics & Data Visualization
Using Adobe After Effects create beautiful VFX Visual Effects, data visualization & VFX Compositing.
What you’ll learn
-
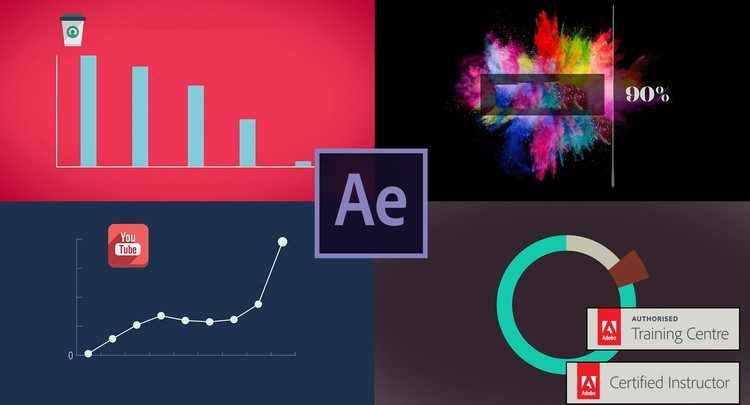
You’ll learn to take Excel spread sheets and animate this in After Effects.
-
You’ll learn how to make animated pie charts, line charts & bar graphs.
-
You’ll learn how to create percentage counters.
-
You’ll learn how to animate icons making beautiful infographics.
-
You’ll learn how to create ‘voice over’ infographics.
-
You’ll learn all the animation techniques needed to bring your data to life.
-
You will have the finished files so you never fall behind.
-
Downloadable exercise files & cheat sheet.
-
Forum support from me and the rest of the BYOL crew.
-
Techniques used by professional motion graphic designers.
-
A wealth of other resources and websites to help your new career path.
FREE DOWNLOAD